Similar
NIOSH-2011-02+ - A line graph with a red line and a line graph with a red line
Summary
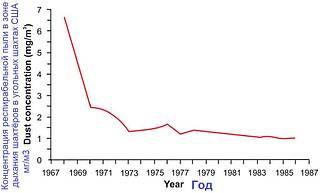
Русский: Рисунок 2 из обзора профзаболеваний шахтёров Coal Mine Dust Exposures and Associated Health Outcomes. Измерение запылённости воздуха (респирабельная пыль) в США 1969-1986г. Средняя концентрация пыли в угольных шахтах США. На графике показано резкое снижение концентрации респирабельной пыли с 7 мг/м3 в 1969г до 1 мг/м3 в 1986г. Источник (1,2).English: Figure 2. Trend in reported dust concentrations for continuous miner operators, 1968–87. [Figure 4–1 of the CCD (1)] (Source: Attfield and Wagner (2)).
Tags
Date
21/04/2015
Source
National Institute for Occupational Safety and Health
Copyright info
public domain


